

I know absolutely nothing about baseball. But I do play a lot of MLB The Show, the only sports video game that is both functional and free of Jake from State Farm cameos. In franchise mode, players are exposed to this scale:
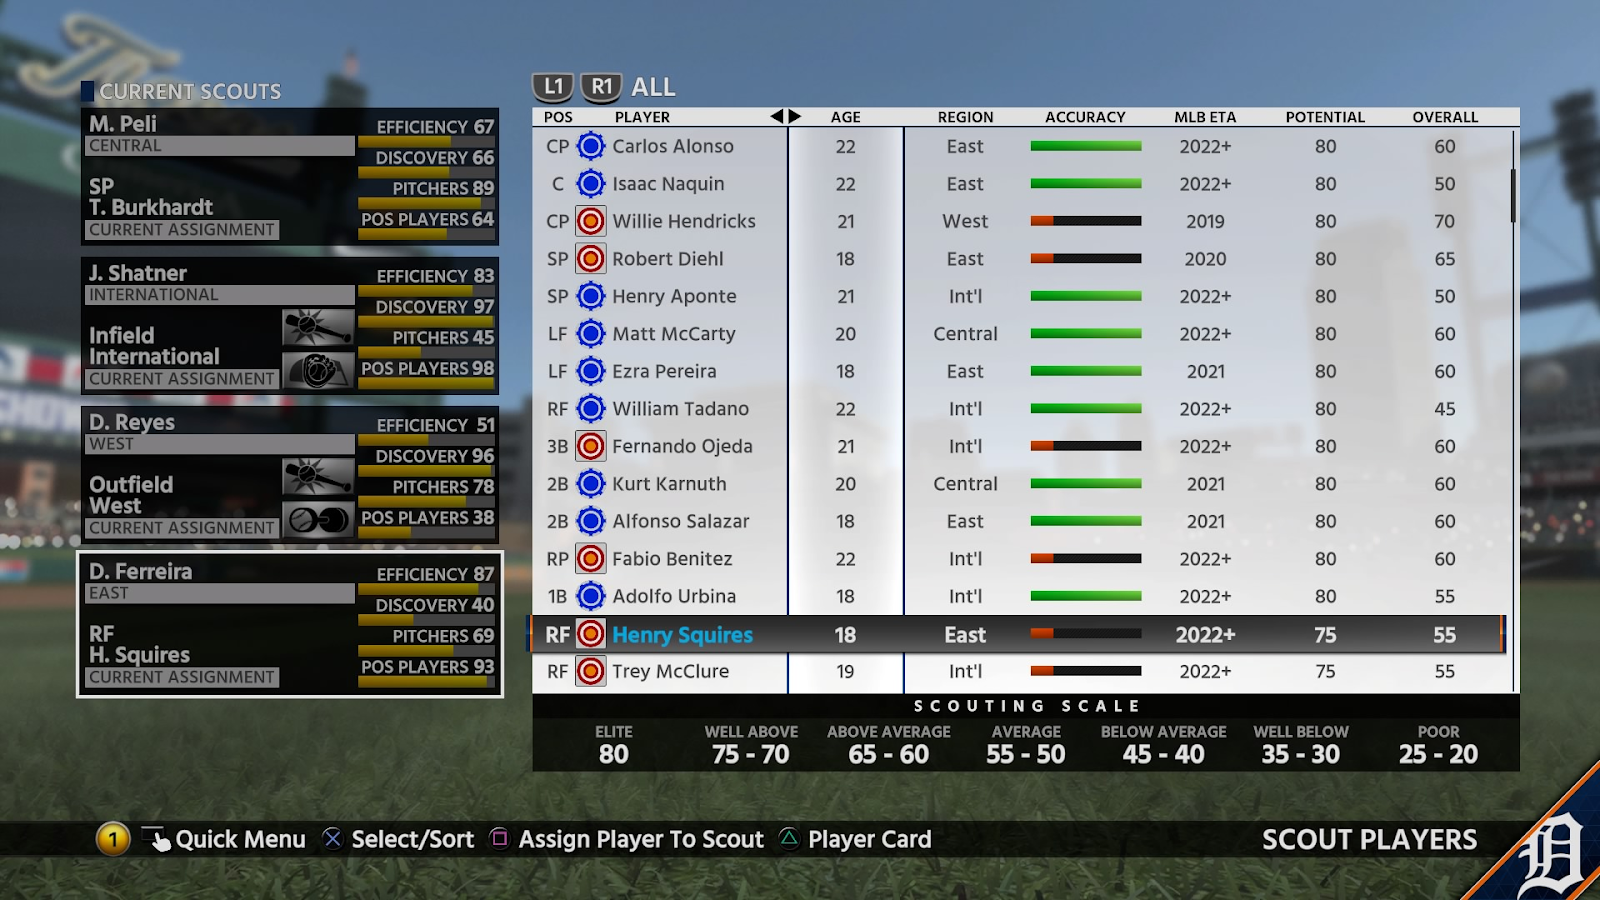
As it turns out, this is the standard scale across most, if not all, of baseball in real life. It makes a ton of sense for evaluators, because the MLB Draft is almost 5 times as long as its NFL counterpart. As such, you have to be able to quickly and intuitively impart upon decision makers what a player does well and what they do poorly; they don’t have time to read a full page report on thousands of players.
Admittedly, I also know very little about the goings on inside an NFL scouting department, but from the little I’ve gathered, everyone has their own way of doing things. This is even more true on Twitter, where it seems like everyone that has thoughts on prospects has their own grading scale. This isn’t a bad thing by any means; I think that when done a certain way, custom scales are more tailored to be exactly what the person using them needs them to be. But there’s so much variety in the foundation of these scales that it’s easy to confuse what exactly a 6.6 means.
All this led Ben Glassmire of RiseNDraft and I to start using baseball’s 20-80 scale as seen above, with a few modifications to make it more useful in a football context. We’ve also added some things for a bit more flair, but the basics of the grading remain the same.
The Grading Scale
Here’s a more in-depth look at how they do things in baseball, with some examples:
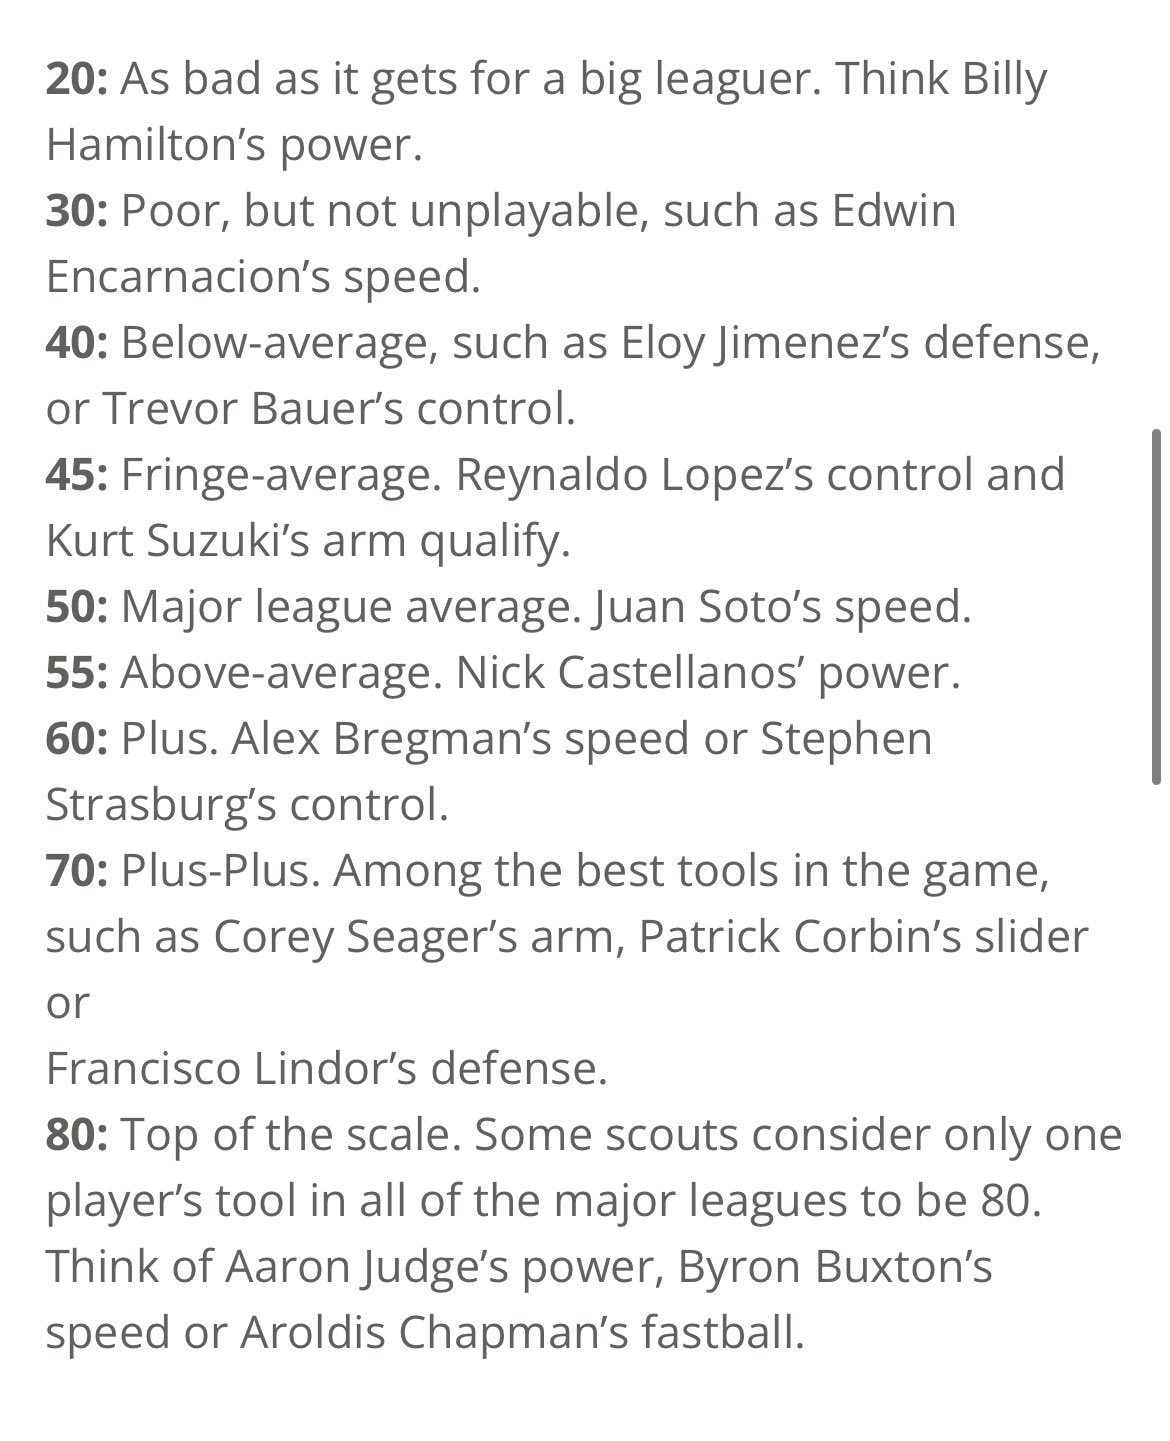
You’ll notice this version knocks out a couple numbers compared to the version in MLB The Show. For the football version, Ben and I decided to add 65 and 75 back in while eliminating 25 and 35, as the lower range really only serves to split hairs on guys who aren’t really pro caliber anyway. That leaves us with this:
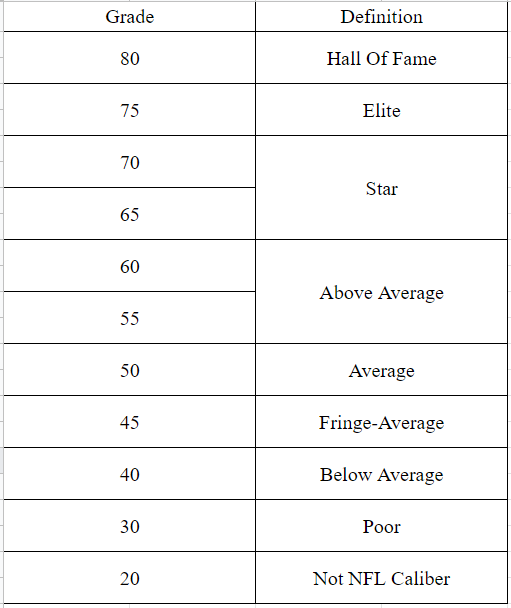
So, essentially the same deal: an 80 is the best of the best, something like Josh Allen’s arm talent or Henry Ruggs’ speed. Not a ton of prospects should get an 80 for any trait, maximum one per draft class. For example, Ben gave Georgia DT Jordan Davis an 80 for size in his report the other day, so none of the other DTs in this class should be getting an 80. Even if it’s exceedingly rare for a college prospect to enter the league as an 80 in any trait, it’s important for the second part of this grading scheme (more on this in a bit).
Also: average here is the average NFL starter. This means that in overall terms, 50 is roughly equivalent to your Christian Kirks or Josey Jewells of the world. Yeah, he’s probably a starter, but you don’t necessarily feel great about it long term. Maybe they have a standout trait that keeps them on the field, but that also means they have a glaring weakness. This is important to remember because it keeps the prospect curve anchored: most guys are not going to be average starters right away. For my own purposes, I’d probably say a player with 50s across the board would be the lowest possible 4th round grade, other factors notwithstanding.
The Traits
Each position has 10 traits to grade on. Ranked from most to least important:
- QB: Arm talent, accuracy, out of structure, pocket presence, decision making, mechanics, touch/placement, progressions, mobility, size/frame.
- RB: Creativity, vision, contact balance, pass catching, long speed, power, explosiveness, blocking, durability, ball security.
- WR: Route running, separation, ball skills, downfield ability, run after catch, contested catch, versatility, release/press, frame, blocking.
- TE: Vertical threat, route running, strength, ball skills, contested catch, explosiveness, blocking, run after catch, versatility, size.
- OT: Pass protection, movement, hand placement, anchor, awareness, run blocking, power, finishing, frame, feet.
- IOL: Pass protection, anchor, hand placement, balance, power, pulling ability, run blocking, feet, versatility, frame.
- IDL: Power, explosiveness, run defense, pass rush, motor, tackling/pursuit, pad level, hands, versatility, frame.
- EDGE: Explosiveness, pass rush plan, first step, strength/power, run defense, motor, tackling/pursuit, bend, frame, versatility.
- LB: Range, football IQ, run defense, tackling, pass coverage, motor, block shedding, pass rush/blitz, versatility, frame.
- CB: Man coverage, instincts, zone coverage, ball skills, tackling/run support, physicality, change of direction, long speed, recovery, frame.
- S: Range, instincts, tackling, run support, change of direction, man coverage, zone coverage, versatility, frame, physicality.
The Grade
This is where room for interpretation comes in. Ben’s report mentions that his final grades are subjective and out of 10. The trait grades are a guideline, but some players end up higher or lower than their trait grades might suggest based on a number of factors. I’m likely going to take a weighted average: middle six traits for each position carry normal weight (1x), top 2 get 1.25x, bottom 2 get 0.75x. So, for example, someone with 60 accuracy would get it bumped to 75 when calculating the final grade, while 60 mobility would be bumped down to 45. This rewards players with traits key to NFL success while de-emphasizing things like size or WR blocking, which are nice to have but not necessary.
(This is the part where I start doing math because I like things to be overly complex. I promise you can follow it. It’s algebra. You don’t have to do it this way.)
So, you have a final trait grade out of 80. Let’s say it’s 50. Divide by 8 to get a score out of 10. You have 6.25. This is 95% of the final grade, the other 5% being RAS (this is why we need it out of 10). Let’s say they have an RAS of 5 for now, since that’s always the average. This brings you to a score of 6.19 when rounded to two decimals.
Next, we adjust for positional value. I’ve written about how I do this before, but as a review:
Take the average draft position of the top player at the position over the last ten drafts (2012-21 for this year). For RB, this is 19.4. Divide by 100 to get a full decimal (0.194), then add 1 (1.194). This works for every position except FB, K, P, and LS, which follow slightly different protocols.
The positional value adjustments for 2022 are as follows:
- QB: 1.028
- RB: 1.194
- FB: 1.611
- WR: 1.107
- TE: 1.24
- OT: 1.069
- IOL: 1.203
- IDL: 1.156
- EDGE: 1.053
- LB: 1.123
- CB: 1.095
- S: 1.198
- K: 1.644
- P: 1.712
- LS: 1.757
Let’s say our hypothetical average player is a QB. So 6.19/1.028 = 6.02, your final grade assuming no red flags (injury, character, etc.). Any of those are a demerit of your choosing from this 6.02 number.
Remember that we said a 50 out of 80 would be the lowest 4th round grade, other factors notwithstanding. That means the lowest 4th round grade is 6.25. The rest breaks down as follows:
- Top 5: 9.07+
- Top 10: 8.76-9.06
- 1st round: 8.14-8.75
- 2nd round: 7.5-8.13
- 3rd round: 6.88-7.49
- 4th round: 6.25-6.87
- 5th round: 5.63-6.24
- 6th round: 5.00-5.62
- 7th round: 4.38-4.99
- Priority UDFA: 4.06-4.37
- Camp Invite: 3.75-4.05
- Not NFL Caliber: 0-3.74
Meaning hypothetical average QB here is a 5th rounder. But, one more thing…
See, Ben’s report also includes a ceiling grade, which in his case is also subjective. Mine is partly subjective and partly mathematically based, but this one is much faster (I promise!).
See the categories beside each 20-80 definition? Decide where you think the player you’re grading lands in their realistic best case outcome. Let’s use Liberty’s Malik Willis as the example here. If he hits his realistic ceiling, I’d say he’d be firmly in the elite category. That’s a 75, divided by 8 is a 9.38 out of 10. That simple!
So, two ways you can go about this from here. What Ben does is present both grades; in our hypothetical it’s 6.02 and 9.38. He hasn’t decided how to parse this into a round value yet, which is fine. For now, we’ll take the average of the floor and ceiling grades to get our final round value. Average of 6.02 and 9.38 is 7.7, equivalent to a second round player.
The Ceiling
This average works fine assuming that you think that it’s equally likely that a player will stay at their floor or hit their ceiling. But that’s not always the case, which brings us back around to our trait grades. Even though we only weight a few of them, they’re all in ranked order. Let’s say arm talent is worth 10 for QBs then, accuracy 9, so on and so forth until you get to 1 for size/frame. Add these up and you have 55, the highest ceiling modifier we’ll give out.
Now, let’s take our average QB we’ve been using for the floor grade, who has a 50 in each trait. 50 of 80 is 62.5%, so go down the line: 62.5% of 10 is 6.25, of 9 is 5.63, etc. Add this up and you get 34.38 out of 55, our average ceiling modifier. Players with this ceiling get to split their floor and ceiling grades evenly, as we did above.
Here’s how it breaks down for the rest:
- 51.56-55: 65% ceiling grade, 35% floor
- 44.69-51.55: 60%, 40%
- 37.81-44.68: 55%, 45%
- 30.95-37.80: 50%, 50%
- 27.50-30.94: 45%, 55%
- 20.63-27.49: 40%, 60%
- 0-20.63: 35%, 65%
But why do this? What’s the point?
Well, besides my undying love of finding more ways to insert miscellaneous numbers into every part of my life, there’s one key factor that makes me think this will be useful. Again, let’s return to the example of Malik Willis. My opinion on this might change with the benefit of more tape viewings, but I currently do not think Willis is a player ready for the NFL right now. Gun to my head, I’d probably say the player he is right now would get a 4th round grade from me. Be that as it may, there’s no utility in giving someone like Willis that grade in my mind if I think he’s going to be taken by the end of round 2 in the real thing because of his tremendous upside. I ran into this same problem with Drew Lock, who I gave a 4th round grade and was taken top 50. To me, if the point of my grading players is to be accurate, ignoring upside makes no sense. Whether or not they hit that upside is a different question entirely, and is a good argument for presenting your floor and ceiling grades the way that Ben has.
Ways to Implement
There’s a number of ways you can put this grading scale in practice, including a ton of ways to avoid doing all this math hoop-jumping that I’m doing. From simplest to most complex:
- Grade each trait on the 20-80 scale. Take an average and use that as your grade, with benchmarks for what each milestone on the scale represents round-value wise.
- Grade each trait, then use those grades as a guideline to give the player a subjective final grade out of 10.
- Do the same as above, but include the subjective grades for both floor and ceiling. This version is what Ben did in his report the other day.
- To include other metrics like RAS, take your average trait grade and divide by 8 to get a score out of 10. Weight the trait grade fairly highly (90-95%). You can also insert the demerits for red flags here if you want to weight those as 5% or so of your grade.
- Do the same as above, but adjust for positional value using the numbers above. You’ve now derived the floor grade, which is also perfectly functional as a final grade.
- Decide on a ceiling grade, then average the floor and ceiling grades as we did above.
- Do every step as described in this article to get your position-adjusted, weighted floor-ceiling final grade. This is the version that I’ll be doing.
I want to emphasize at this point that this scale is, like everything, not perfect. Ben and I have graded a grand total of one player using this new scale and it wasn’t even a final report. The plan is to tweak this as we go to make it more accurate – some of the weights here are assuredly off, some traits may be more or less important than we decided they were this time around, things like that. Ultimately, the goal between the two of us is to develop a scale that makes sense and is deadly accurate (relatively speaking). With all the extra calculations and adjustments I’m making, my goal is to pinpoint which traits matter and which don’t, position by position. Eventually, the hope is to break this out by scheme to nail down which players will succeed in what situations. Grades should, in my opinion, be driven by context. It’s why both Ben and I arrived at the conclusions we did. For Ben, the subjectivity of his final grade creates context; allows him to inflate or deflate a grade based on factors outside the trait grades. For me, the numbers serve the same purpose. The ultimate goal is the same: contextualized, accurate, to-the-point grading.
Follow Alex @alexkatson.

3 thoughts on “Process Talk: The Scale”